

It is important to track your Amazon search analytics as a seller on the marketplace. Without this data, you can’t possibly hope to improve your selling rate and maintain competitiveness in today’s market.
This article outlines all the ins and outs of Amazon search analytics so that you can start making data-driven decisions about how to improve your products’ visibility on the site through Amazon Product Photography, listing, and marketing campaign optimization. Keep reading to learn more!

How Can Data Driven Decisions Aid You In Improving Your Selling Rate?
For e-commerce sellers, data gathered through analysis can provide valuable insights that help them stay ahead in today’s competitive marketplaces.
Search analytics or Brand Analytics is a powerful tool for understanding where and how you can improve in order to earn maximum returns on Amazon. They help businesses understand their market trends and customers’ buying behaviors, which in turn can be used to improve their strategies and provide what customers really want. As opposed to just trying out various new tactics without knowing if they will work!
Some benefits of making data-driven decisions with the help of Amazon search analytics are:
- Data analytics provides sellers with insights into their CTR and allows them to easily understand how many shoppers clicked on advertisements and completed purchases by looking at the data and numbers from these conversions. Using this information, they can optimize advertising campaigns or adjust product listings for increased sales rates.
- Search analytics has the ability to pinpoint problems within your business model or the way you are optimizing your listing advertisements. Sellers will be able to identify where they’re losing money and what’s wrong so that future losses can easily be reduced, facilitating strategic solutions for those issues as well.
- It is the safest way to make any business decision. Sellers can do so with confidence, knowing that it is backed by factual data, which will lead them well in all their future endeavors, whether they’re looking to improve their selling rate or just trying out some new marketing strategy.
- With the aid of Amazon search analytics, sellers can see what products have been selling well and which ones are slow-moving. This information will help you with not only optimization but also inventory management as well.
What Are The Various Types Of Report From Amazon Brand Analytics?
Amazon Brand Analytics allows you access to various types of reports which can aid you in improving your selling rate.
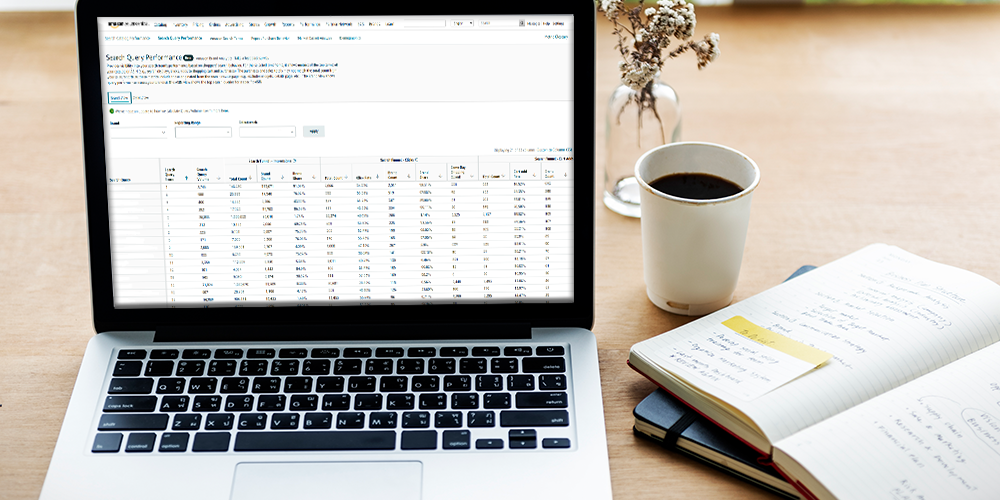
1. Search Query Performance Dashboard:
The Query Performance dashboard is a great way for brand owners to see how customers are searching for and then subsequently find their product. This gives brand owners insight into where their potentially low-performing keywords may be located, which will help them make changes accordingly.
It also helps identify high-performing keywords and how they can be used effectively. This dashboard provides visibility into the performance of search queries associated with your brand.
2. Search Catalog Performance Dashboard:
This dashboard gives you a birds-eye view of how your catalog is performing from the perspective of the Amazon search engine. It’s easy to see any trends and understand what areas need more attention in order for them to be successful!
The Search Catalog Performance Dashboard displays metrics on how customers interact with your products through the search shopping journey, including impressions, clicks, add-to-cart, and purchases.
3. Repeat Purchase Behavior Report:
The Repeat Purchase Behavior report is a great way to strategize and assess your marketing campaigns. This means you can better target existing customers to make repeat purchases. This report shows how many times each product or brand was ordered and how many unique customers placed the orders.
4. Market Basket Report:
With the Market Basket report, you’ll be able to see which top three products Amazon customers most frequently purchased at the same time they bought your products. This will allow for more effective bundling and create cross-marketing opportunities!
5. Item Comparison Report:
The Item Comparison Report is a great tool for brand owners to use when making advertising and portfolio decisions. It shows the competing products that Amazon customers viewed most frequently in one day, allowing you to make informed choices about what you should be focusing your efforts on promoting or marketing campaigns toward.
This report will highlight the top five products most frequently viewed, along with their percentage popularity on a given day.
6. Demographics Report:
The Demographics report is crucial for Brand owners to understand their customers. It will allow them to assess the need and success of targeted marketing campaigns, as well as make product portfolio decisions based on demographic interest on Amazon’s platform.
The Demographics report shows the breakdown of sales of a Brand owner’s ASINs by customer demographic. The report also highlights products associated with a registered brand, as well as the number of unique customers for each product. This information is only currently provided to American registered brands.
7. Amazon Search Terms Report:
The Amazon Search Terms report is a great way to see what people are searching for. It helps you determine which keywords your competitors might be ranking highly on.
This report shows the most popular search terms in the Amazon store, as well as how often each term is searched and what products are being clicked on afterward. Brand owners can look up terms or products to see what Amazon customers are clicking on after searching for those terms.
The search term report has a table that refreshes weekly and indicates if any products have fallen from the top three clicked ASINs for a given search term.
8. Alternate Purchase Report:
The alternate purchase report allows Brand owners to see which top five products Amazon customers as a collective most frequently purchased on the same day they viewed instead of purchasing your brand’s product. This insight can help you understand how best you differentiate yourself from competitors and build a good portfolio among your customer base.
Conclusion:
As an Amazon seller, you know that your success depends on two things – the quality of your products and how well you rank in an Amazon search. The better you understand Amazon search analytics, the easier it will be to improve your selling rate.
In this post, we’ve outlined some of the most important reports from Amazon Brand Analytics and explained what they could tell you about your customers’ behavior. We also provided a few tips for improving your product ranking based on data-driven decisions. If you want to take your Amazon business to the next level, make sure to implement these principles in addition to high-quality Amazon Product Photography into your marketing strategy.
Need help getting started? We can happily assist you with all of your Amazon marketing needs!
Keep up with the latest Amazon and Walmart news updates and subscribe to our BellaVix newsletter 👇👇👇