

Amazon Search Analytics
As mentioned in a previous article, Amazon has launched some new and exciting features available only in Beta. We covered the latest reports you can find inside Brand Analytics. We talked about the Search Query Performance Tool, an influential report that offers reliable information at a keyword level. The data is provided for the first one thousand ranked search queries, and you get to see how your brand performed in search volume, impressions, clicks, cart adds, and purchases.
All this new information that Amazon is handing us allows us to understand better how customers search for our products. We can improve and optimize our listings in terms of description, backend keywords, and, most importantly, how to diagnose sales funnel problems.
It should be noted that Brand Analytics is a brand benefit that can only be accessed by sellers who have already registered a brand.
Where to find Search Catalog Performance?
After logging into your Amazon account, go to the Seller Central dashboard and click on ‘Brands’ and ‘Brand Analytics’. The next step is to click on ‘View Search Analytics’, where you will find access to this tool.
The Search Query Performance Tool provides you with information that led to your brand interaction for the first 1,000 search queries that cover both organic and paid search results. The Search Catalog Performance Tool shows you the same KPIs (impressions, clicks, cart adds, and purchases) for your brand, but this time at an ASIN level.
The SCP Report can go back up to forty weeks, almost nine months of data, and this is a big difference as opposed to sixty-five days that you can view and download in the advertising console’s Advertised Product Report. The reporting range can be changed, and you can get data per week, month, or quarter. There is also an option to filter results by Brand or by ASIN.
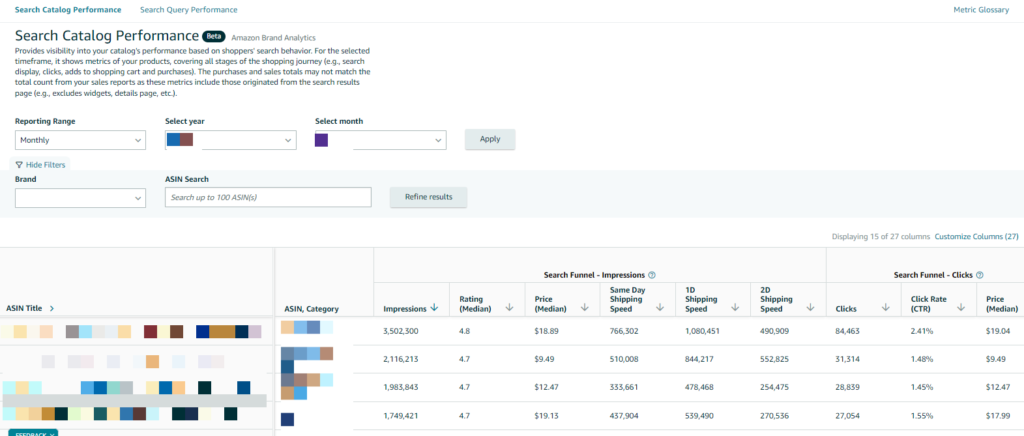
This information is first-party, directly from Amazon. You can now benefit from and take advantage of this inside data. It will help you better understand the customer journey for each advertised ASIN. But note that these metrics will only include Amazon’s data (paid and organic) from the search results page and not from widgets, details page, etc.
That means that any of your catalog ASIN’s will have other metric totals for the period covered.
Understanding the Data
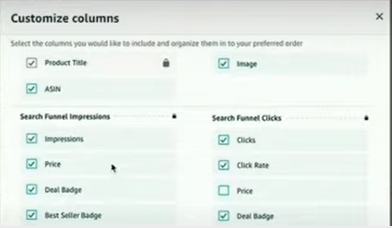
In the upper right corner, you can customize columns. You can add same-day shipping speed (customers receive the products within the day after purchasing them), one-day shipping speed (captures the number of times ASINs with ‘One-Day’ delivery message is ‘impressed/clicked/cart-added/purchased’ in the search results page), two-day shipping speed (captures the number of times ASINs with ‘Two-Day’ delivery message is ‘impressed/clicked/cart-added/purchased’ in the search results page) or rating (for each ASIN).
We can expect to see other metrics in the future. In Amazon’s presentation, we noticed two different indicators, ‘Deal Badge’ and ‘Best Seller Badge’. This information can measure the performance difference for each ASIN while having one of these badges and compare that to another period when you didn’t have them. Being in Beta, this data isn’t currently available to us, and we don’t know when to expect it or which accounts will have access to it.
We can diagnose where the funnel is converting and where we’re falling off, quickly identify products that merit a closer inspection, and see products close to being winners and those that are off the mark. Let’s take a screenshot as an example and check the performance.
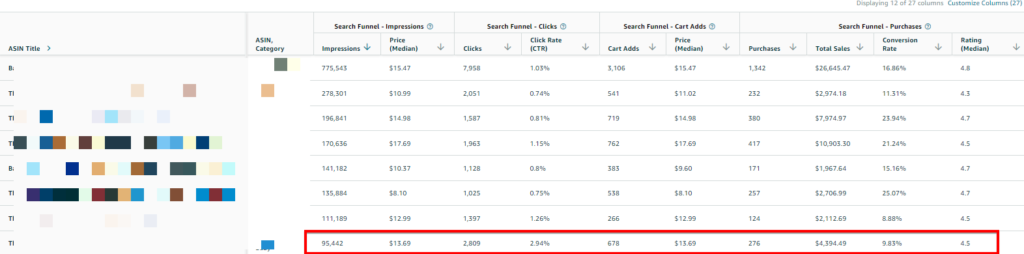
At first glance, you would say that the click-through rate is low. But being products in the beauty category can easily explain the lower overall numbers in CTR. Let’s take the red highlighted product as an example. Although its CTR is one of the best of all the presented products, the conversion rate is drastically lower. The product appears in search results, and the customers highly believe it aligns with their intent and visits the detail page. It is either this or ranks better in SERP than the other products. After they see the product page, we notice a low CVR, and the product ends up with the second-lowest conversion rate (purchases divided by clicks). While still a booming 9.83%, it is deficient compared to the other products. This listing will need attention and investigation on the product’s pictures and detail page to see what can be improved.
Final Thoughts
Amazon listened to the advertiser’s analytics needs and now offers them a deeper understanding of how customers search for their products to help them grow their brands. Using the two reports can be highly beneficial. Amazon has communicated that it will launch incremental improvements throughout the year, continuing to add more data and features.
I hope this helped you understand how to use the Amazon Search Catalog Performance Tool inside Brand Analytics. As always, if you have any questions or comments, please feel free to reach out to us.
If you’re looking for help with your Amazon business, we offer a range of services to help you grow and scale your business. Thank you for reading!
Keep up with the latest Amazon and Walmart news updates and subscribe to our BellaVix newsletter 👇👇👇